How spilling works
The fundamental idea of spilling is to write intermediate state to disk in a partitioned way when the data set is too big to process entirely in memory, and then process the partitions in memory one by one. The following sketch illustrates this: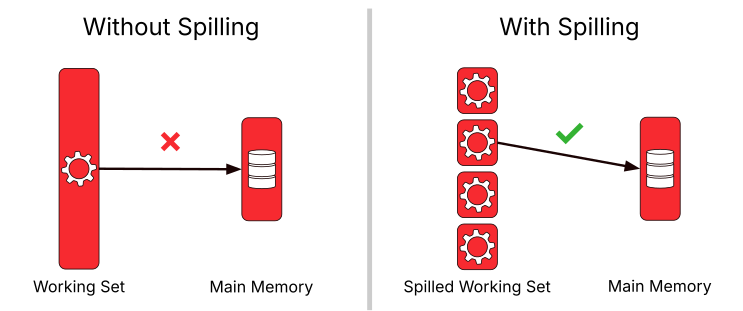
Implications of spilling
When an operator spills, it has to write a significant amount of data to the SSD cache and later read it back. This comes at a performance cost. If the engine has only slightly too little memory, using a bigger engine — whether by scaling up or by scaling out — can avoid the need for spilling and result in significantly reduced latency.Observability
If a query made use of spilling, you will see a non-zero value in thespilled_bytes column of information_schema.engine_query_history describing how many bytes were spilled to the SSD cache in total by all spilling operators in the query. Additionally, you can monitor the amount of spilled data on the SSD cache at any particular time in the spilled_bytes column of information_schema.engine_metrics_history or in the “engine monitoring” section of the Firebolt Web Interface.
Example
You can easily test spilling for yourself with the following query on an engine with a single node of type “small”:spilled_bytes metric in information_schema.engine_metrics_history increases while the aggregation processes and spills input, and then starts decreasing again as spilled data is merged and deleted.
Limitations
Not all queries can benefit from spilling. Spilling is not implemented for theORDER BY operator and for window functions. Additionally, aggregations where the size of a single key’s state exceeds the available memory, such as a count(distinct) without a GROUP BY clause on a column with a huge amount of distinct values, cannot currently spill. Such queries could still fail with an out-of-memory error if spilling in other queries or operators cannot free up enough memory for these non-spilling-enabled operators.
Spilling is also limited by the available SSD cache. Once the cache is full and no non-essential data remains to be evicted from cache, spilling cannot proceed, and the query will fail. Of course, any leftover spilled files will be cleaned up in such cases, ensuring that the SSD cache capacity is made available again for caching or spilled data from other queries.