Choose your deployment model
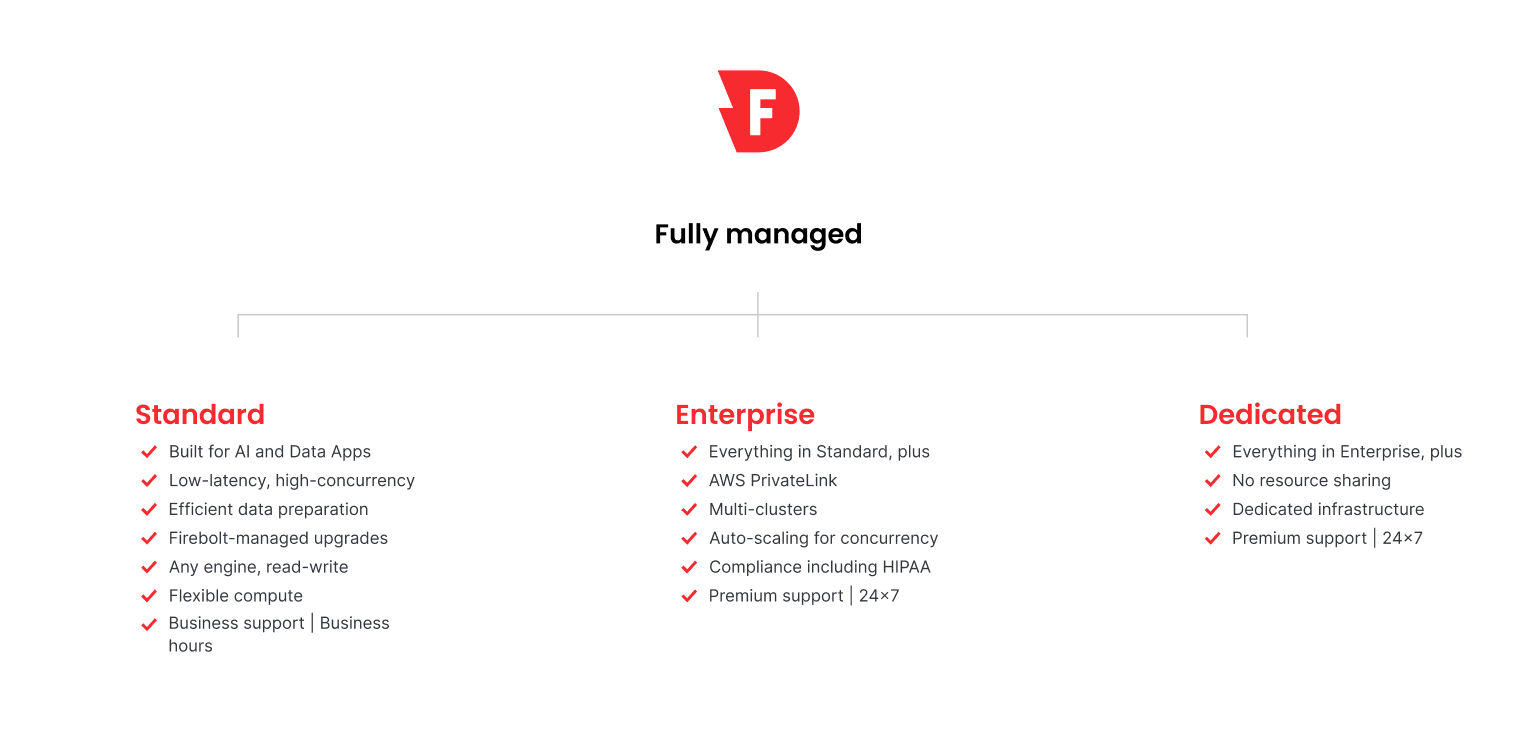
Firebolt offers two deployment models: fully-managed and self-managed. Each model includes specific editions and pricing options.- The fully-managed deployment option includes Standard, Enterprise, and Dedicated editions with Pay-As-You-Go or Committed-Use discount pricing
- The self-managed deployment model includes Firebolt’s Firebolt Core, with pricing based on your infrastructure setup.
Fully managed editions and pricing
Firebolt manages compute infrastructure, software maintenance, and upgrades across all fully-managed editions. Firebolt handles multi-dimensional elasticity, high performance, scaling, maintenance, and performance optimizations.- Fully-managed editions – Firebolt offers the Standard, Enterprise and Dedicated editions.
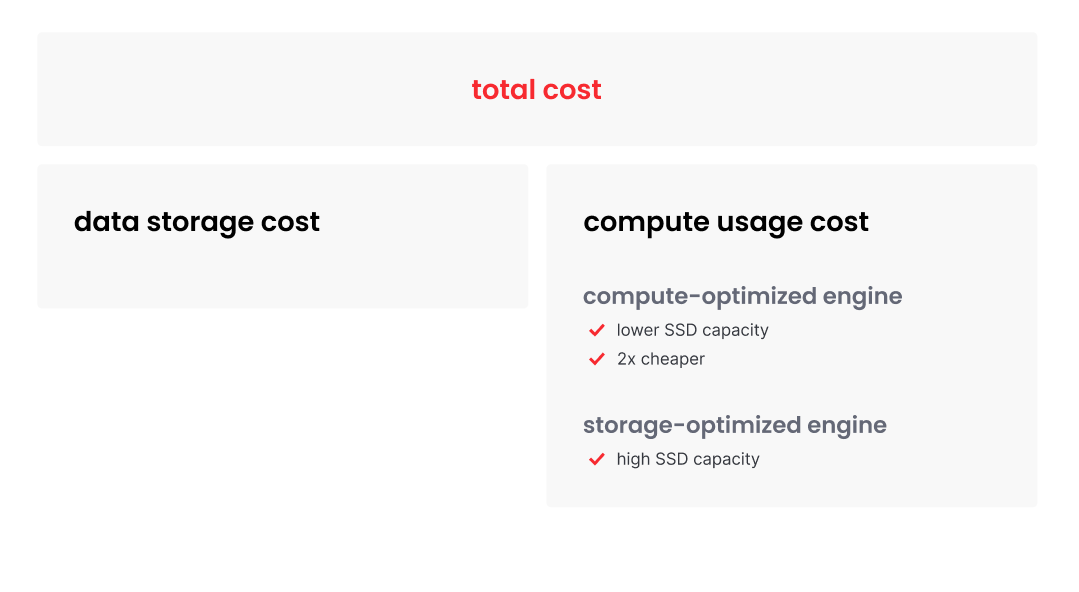
- Fully-managed pricing model – Your total price consists of a storage and a compute cost.
- Data storage pricing – The storage portion of your total cost.
- Compute usage pricing – The compute portion of your total cost.
- Fully-managed pricing plans – How to pay for resource usage.
- Billing setup and monitoring – How to use the Billing dashboard to view resource consumption and set up billing and a plan.
- Set up billing for fully-managed plans – How to set up pay-as-you-go billing through AWS Marketplace.
- Sign up or change your fully-managed edition – How to set up or change your fully-managed edition type.
Looking to generate billing reports with SQL?
Jump to the Billing Reports with SQL section for examples on how to query compute and storage costs.Fully-managed editions
There are three editions available: Standard, Enterprise, and Dedicated.
The Standard edition is best for teams seeking a low-cost entry point without the need to manage compute infrastructure. It offers high performance with sub-second query latency, flexible compute scaling within a single cluster. Security features include Role-Based Access Control (RBAC), single sign-on (SSO), multi-factor authentication (MFA), and audit logging. Standard includes a flexible compute option that is optimized for either storage or for compute. Firebolt manages your compute infrastructure, software maintenance, and upgrades. Enterprise edition
The Enterprise edition is designed for organizations that need advanced security, compliance, and automatic compute scaling. It includes all the features in the Standard edition, plus multi-cluster scaling, auto-scaling for concurrency, AWS PrivateLink, and HIPAA compliance support. Dedicated edition
The Dedicated edition is ideal for organizations that require high levels of security and isolation, such as those operating in government clouds. It includes all the features in the Enterprise edition, plus complete data isolation on a single-tenant infrastructure, offering the highest level of security.
Fully-managed pricing model
The total cost for Firebolt’s fully-managed editions consists of a cost for data storage plus a cost for compute usage. The compute usage cost depends on the type of engine that you select: compute-optimized or storage-optimized.
Data storage pricing
Data storage costs are based on the amount of compressed data stored, including indexes and raw data. Pricing is based on Amazon S3 costs in your selected AWS region. There are no additional storage charges beyond S3 costs.| Available AWS Regions | Region code | Price per TiB/month ($USD) |
|---|---|---|
| US East (N. Virginia) | us-east-1 | $27.07 |
| US West (Oregon) | us-west-2 | $27.07 |
| Europe (Frankfurt) | eu-central-1 | $28.84 |
| Europe (Ireland) | eu-west-1 | $27.07 |
| Asia Pacific (Singapore) | ap-southeast-1 | $29.43 |
| Asia Pacific (Mumbai) | ap-south-1 | $29.43 |
Compute usage pricing
Compute costs are measured in Firebolt Units (FBUs) and vary based on engine node type, number of nodes or cluster size, the number of clusters and usage duration. Costs are only billed for the time Firebolt engines are running. Firebolt offers two compute family options:- Storage-optimized (default): High SSD capacity for caching and production workloads.
- Compute-optimized: About 2x cheaper; ideal for development and test environments or workloads with smaller active datasets.
| Node type | Compute family | Sizing in FBU |
|---|---|---|
| Small (S) | Storage-optimized | 8 |
| Medium (M) | Storage-optimized | 16 |
| Large (L) | Storage-optimized | 32 |
| Extra Large (XL) | Storage-optimized | 64 |
| Small (S) | Compute-optimized | 4 |
| Medium (M) | Compute-optimized | 8 |
| Large (L) | Compute-optimized | 16 |
| Extra Large (XL) | Compute-optimized | 32 |
| Node Type | Sizing in FBU | Standard: US Region Pricing ($0.23/FBU/hr) | Enterprise: US Region Pricing ($0.35/FBU/hr) | Standard: Non-US Region Pricing ($0.28/FBU/hr) | Enterprise: Non-US Region Pricing ($0.42/FBU/hr) |
|---|---|---|---|---|---|
| Small (S) | 8 | $1.84 | $2.80 | $2.24 | $3.36 |
| Medium (M) | 16 | $3.68 | $5.60 | $4.48 | $6.72 |
| Large (L) | 32 | $7.36 | $11.20 | $8.96 | $13.44 |
| Extra Large (XL) | 64 | $14.72 | $22.40 | $17.92 | $26.88 |
| Node Type | Sizing in FBU | Standard: US Region Pricing ($0.23/FBU/hr) | Enterprise: US Region Pricing ($0.35/FBU/hr) | Standard: Non-US Region Pricing ($0.28/FBU/hr) | Enterprise: Non-US Region Pricing ($0.42/FBU/hr) |
|---|---|---|---|---|---|
| Small (S) | 4 | $0.92 | $1.40 | $1.12 | $1.68 |
| Medium (M) | 8 | $1.84 | $2.80 | $2.24 | $3.36 |
| Large (L) | 16 | $3.68 | $5.60 | $4.48 | $6.72 |
| Extra Large (XL) | 32 | $7.36 | $11.20 | $8.96 | $13.44 |
Fully-managed pricing plans
Firebolt offers two pricing options for the Standard and Enterprise editions:- Pay-as-you-go: A flexible plan that provides on-demand pricing with no upfront cost or commitment. This plan is ideal for startups or teams with unpredictable workloads. Customers get billed monthly based on actual usage and only pay for what they use with per-second billing.
- Committed-use discounts: A consumption model that provides discounted rates against a prepaid usage commitment. This plan is ideal for organizations with consistent, high-volume workloads and results in lower total costs compared to the pay-as-you-go plan. Once all prepaid FBU credits are consumed, your plan switches to the pay-as-you-go pricing model. Customers can always continue using Firebolt, with consumption either drawing from prepaid credits or transitioning to the pay-as-you-go model when credits run out.
Billing setup and monitoring
You can use Firebolt’s billing dashboard to monitor resource consumption, track expenses, monitor payments, and analyze billing trends efficiently. To view the billing dashboard, follow steps 1-3 in the following section to set up billing for fully-managed plans. Billing invoices are generated on a monthly basis, and provide a detailed breakdown of resource consumption and associated costs.Set up billing for fully-managed plans
Pay-As-You-Go setup via AWS Marketplace:- Log in to Firebolt’s Workspace. If you haven’t yet registered with Firebolt, see the Get Started guide.
- In the Firebolt Workspace, select the Configure(
 ) icon from the left navigation pane.
 - Under Configure, select Billing. This page allows you to view invoices and consumption details.
- Select Connect to AWS Marketplace.
- On AWS Marketplace, click View Purchase Options > Setup Your Account.
Sign up or change your fully-managed edition
If you want to sign up or upgrade your fully-managed edition type, you can choose the Standard, Enterprise or Dedicated plan. Select your new choice in the Firebolt Workspace as follows:- Log in to Firebolt’s Workspace.
- In the Firebolt Workspace, select the Configure (
 ) icon from the left navigation pane.
 - Under Configure, expand the drop-down list next to Billing.
- Under Billing, select Plan to open the list of available plans. Your active plan is labeled as Current Plan. For information about each plan, select Learn more to be directed to Firebolt’s Pricing page.
- Select your desired plan.
- To select the Standard or Enterprise plan, choose Select plan and confirm your selection.
- To select the Dedicated plan, do the following:
- Choose Talk to Sales.
- In the pop-up window, Your email is automatically populated with the email associated with your login.
- Enter a Subject or accept the default Pricing plan entry.
- Enter a Description.
- Select Send to notify Firebolt’s support team.
Changing your plan is not immediate and may take up to 24 hours to process. You will receive updates about the status of your request through email.
Self-managed edition: Firebolt Core
Firebolt Core is a free, downloadable edition of Firebolt designed for teams seeking complete control and flexibility. It can be deployed in the cloud, on-premises, or locally, making it ideal for customized environments requiring a lightweight yet powerful engine. With Firebolt Core, customers manage their own infrastructure, hosting, software upgrades, and maintenance. Key features of Firebolt Core:✅ Deployable on-premises, in the cloud, or locally
✅ Full infrastructure control and management
✅ Free to use, forever
✅ Community-based support
Support plans and service level agreements
Firebolt offers support options based on your selected edition. Response Time Commitments (TFR = Time to First Response)| Severity Level | Issue Type | Business support: TFR for Standard Edition | Premium support: TFR for Enterprise & Dedicated |
|---|---|---|---|
| Critical (Sev1) | Service outage or major disruption | Response within 4 hours | Response within 30 minutes |
| High (Sev2) | Significant performance degradation | Response within 8 business hours | Response within 2 hours |
| Medium (Sev3) | Minor impact or feature issue | Response within 24 business hours | Response within 6 business hours |
| Low (Sev4) | General inquiries or documentation questions | Response within 48 business hours | Response within 24 business hours |
- Proactive monitoring: Alerts for issues and potential optimizations available to Enterprise edition customers.
- Enhanced support channels: Support through Slack, email and the help menu in the Firebolt Workspace.
- Dedicated support engineer: Customers are assigned a designated support engineer with deep knowledge of their environment, providing personalized support. This premium support level differs from Standard customers, who receive assistance from the general support pool.
Generate billing reports with SQL
You can use Firebolt’sinformation_schema.compute_billing and information_schema.storage_billing views to build detailed billing reports using SQL. These views provide granular data on compute and storage usage, costs, credit usage, and regional distribution, allowing teams to analyze and optimize their consumption.
For detailed information about
consumed_gib_per_month usage and calculations, see Understanding Storage Billing, about FBU see Engine Consumption.